How to Catch AWS Lambda Jobs That Succeed but Write Nothing
Tooling catches crashes and misses empty success. Here's a contract, EMF metrics, a Step Functions check, and a regression test for jobs that write nothing.
A session commit reports success, and the memory extraction behind it produced zero memories. Nothing failed, no metric moved, the run is marked done, and whatever the model learned is gone.
The rule I'd add to both: a pipeline that processes a non-empty input and writes nothing has failed, even if every status says OK. The one exception is when it can say why.
Every green light here is telling the truth
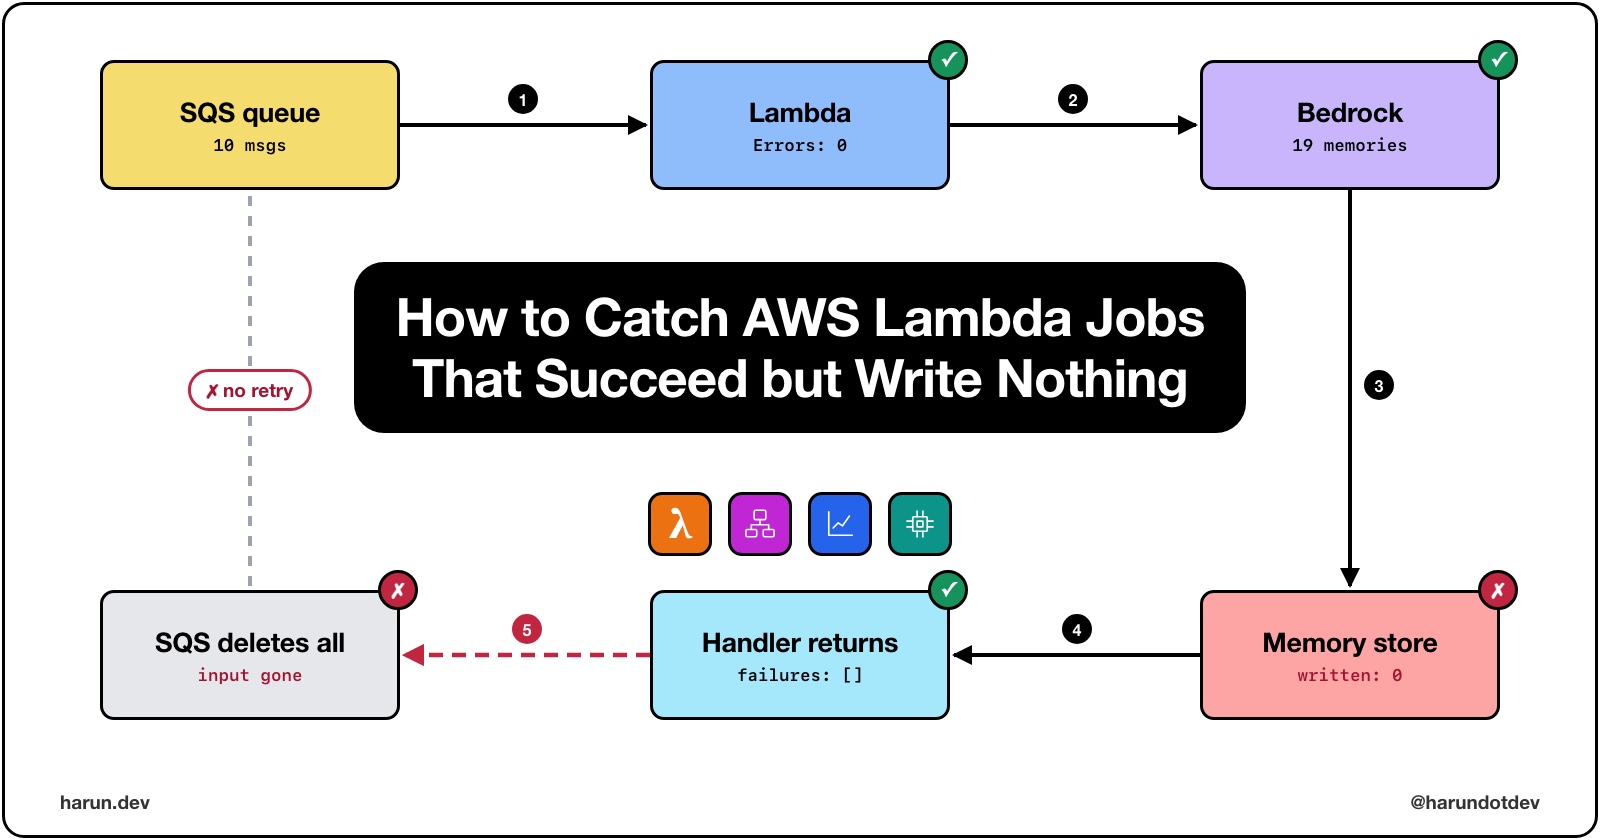
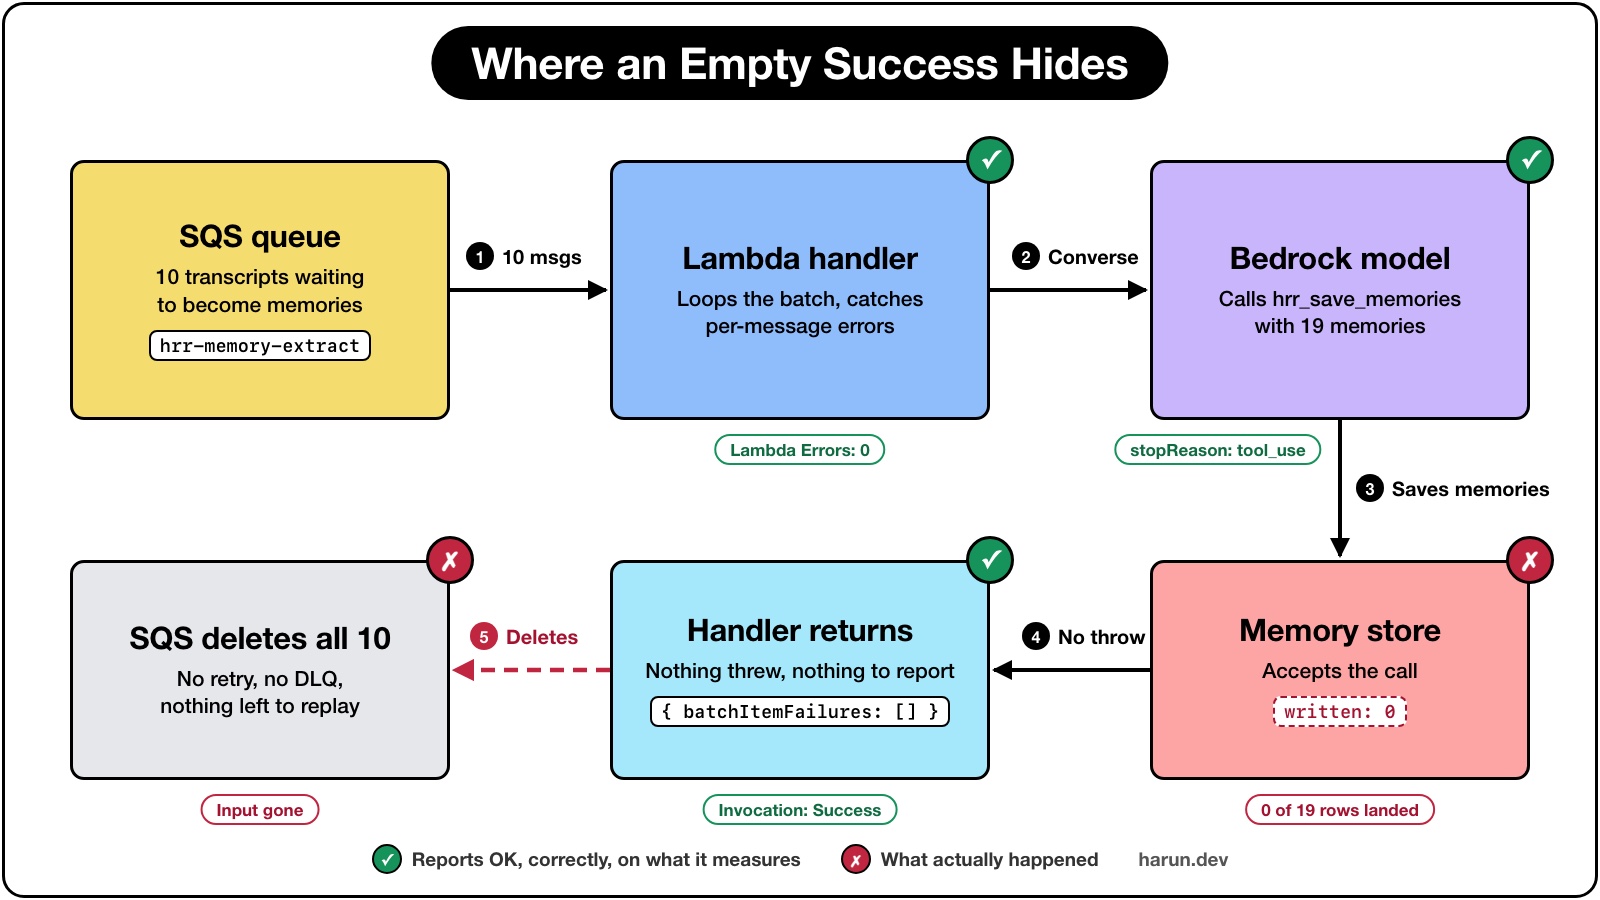
Our tooling is built to catch crashes. An empty success isn't a crash, so each layer reports correctly on the narrow thing it measures.
Lambda's Errors metric counts invocations that end in a function error. A handler that returns normally isn't one.
SQS deletes the messages when the handler returns an empty batchItemFailures.
A Step Functions Map state over an empty array has nothing to fail on.
Retries don't fire, because nothing threw.
Every check mark is true. The two crosses are what actually happened, and nothing on the left side of the diagram can see them.
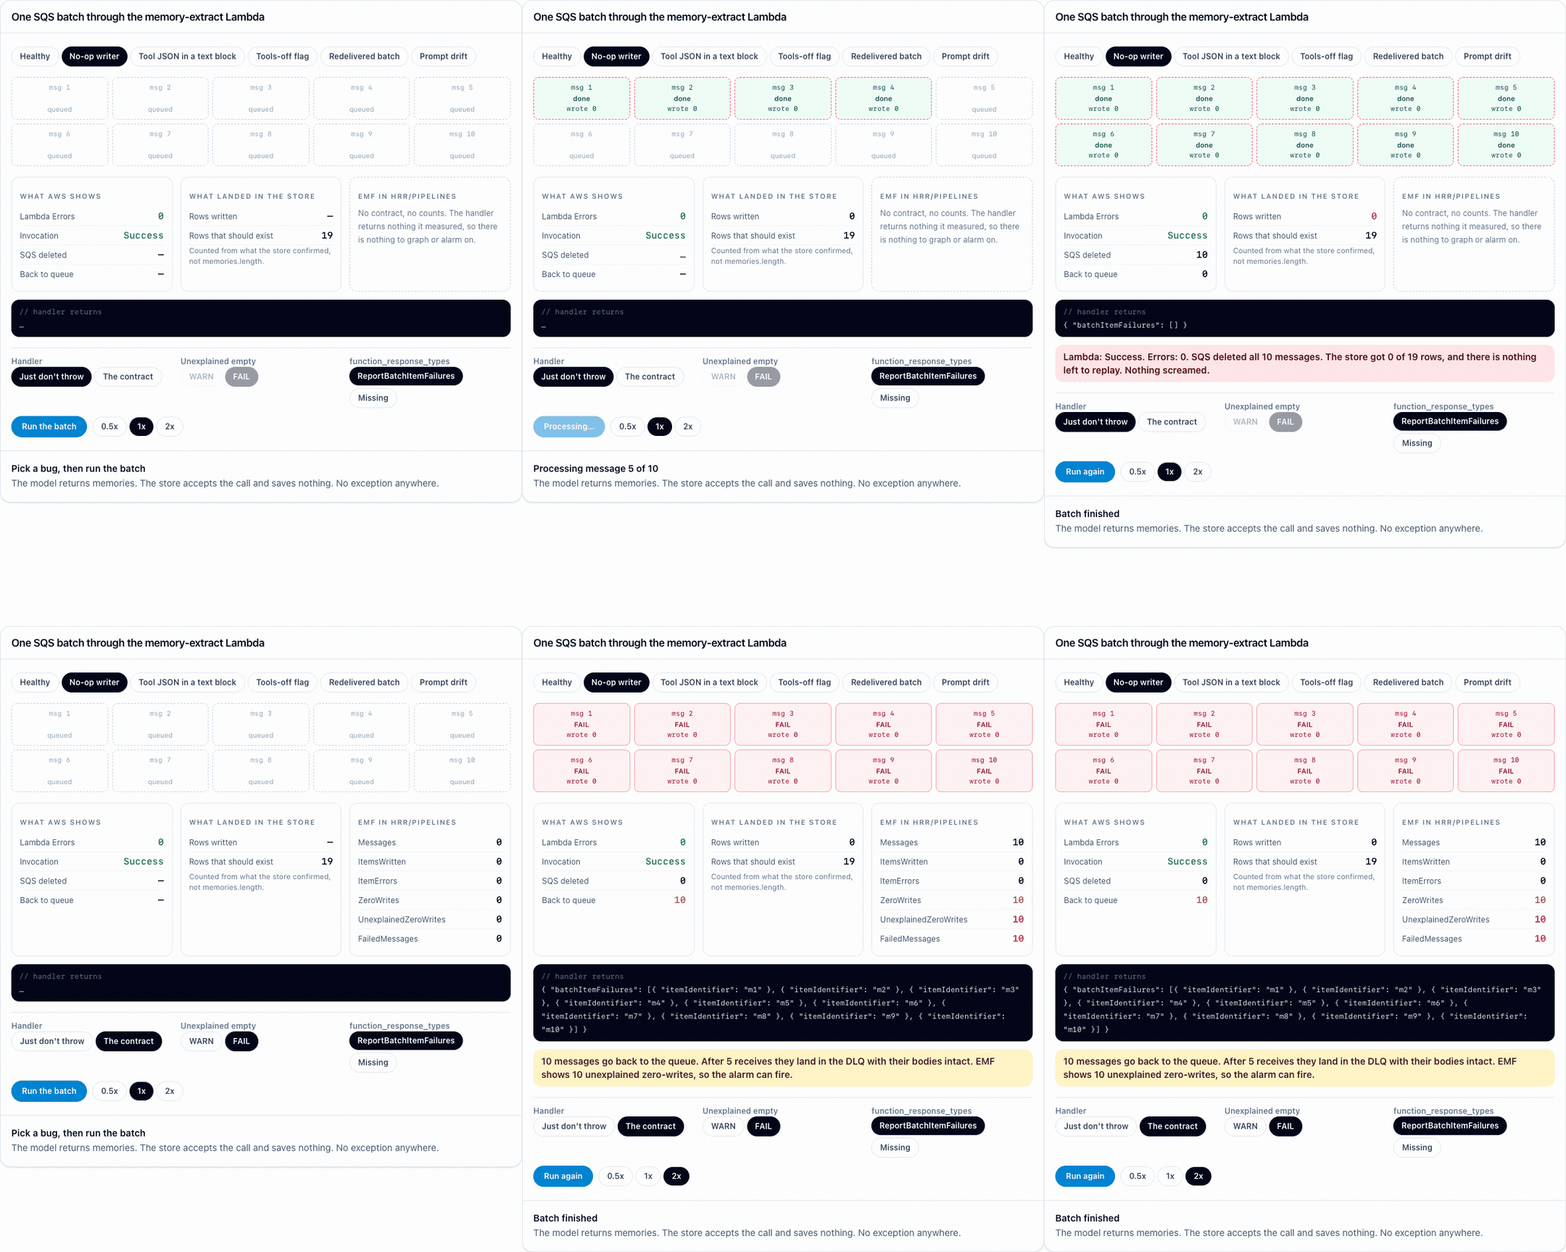
Run the bug yourself before reading any code. The figure below runs one ten-message SQS batch through a memory-extract Lambda. Pick what goes wrong, run the batch, and compare what AWS shows with what actually landed. Then switch the handler to the contract from the next section and run the same bug again. Flip function_response_types off too, because that one bites people who did everything else right.
The Langfuse and CloudWatch setup I wrote about earlier won't catch this either. It tells you what the model did and what it cost. This post is about one narrower question: did anything land?
The contract is three fields and one excuse
Every batch, extraction and ingest Lambda returns the same shape, {ok, itemsWritten, errors[]}. I'd add a fourth optional field, because SQS is at-least-once and a redelivered message can legitimately write nothing when the first delivery already did the work. The idempotent re-run in the RAG post does that on purpose. Without a way to say so, every duplicate looks like the bug.
export type HrrError = { code: string; message: string };

export type HrrResult = {
  ok: boolean;
  itemsWritten: number;
  errors: HrrError[];
  emptyReason?: "duplicate" | "nothing_to_extract" | "empty_input";
};

type HrrPolicy = "WARN" | "FAIL";

export function hrr_verdict(result: HrrResult, onUnexplainedEmpty: HrrPolicy) {
  if (!result.ok) return "FAIL";
  if (result.itemsWritten > 0) return "OK";
  if (result.emptyReason && result.errors.length === 0) return "OK";
  return onUnexplainedEmpty;
}
hrr_verdict assumes the input wasn't empty. An empty input has to say empty_input out loud, same as any other excuse, and an excuse doesn't count if errors has anything in it.
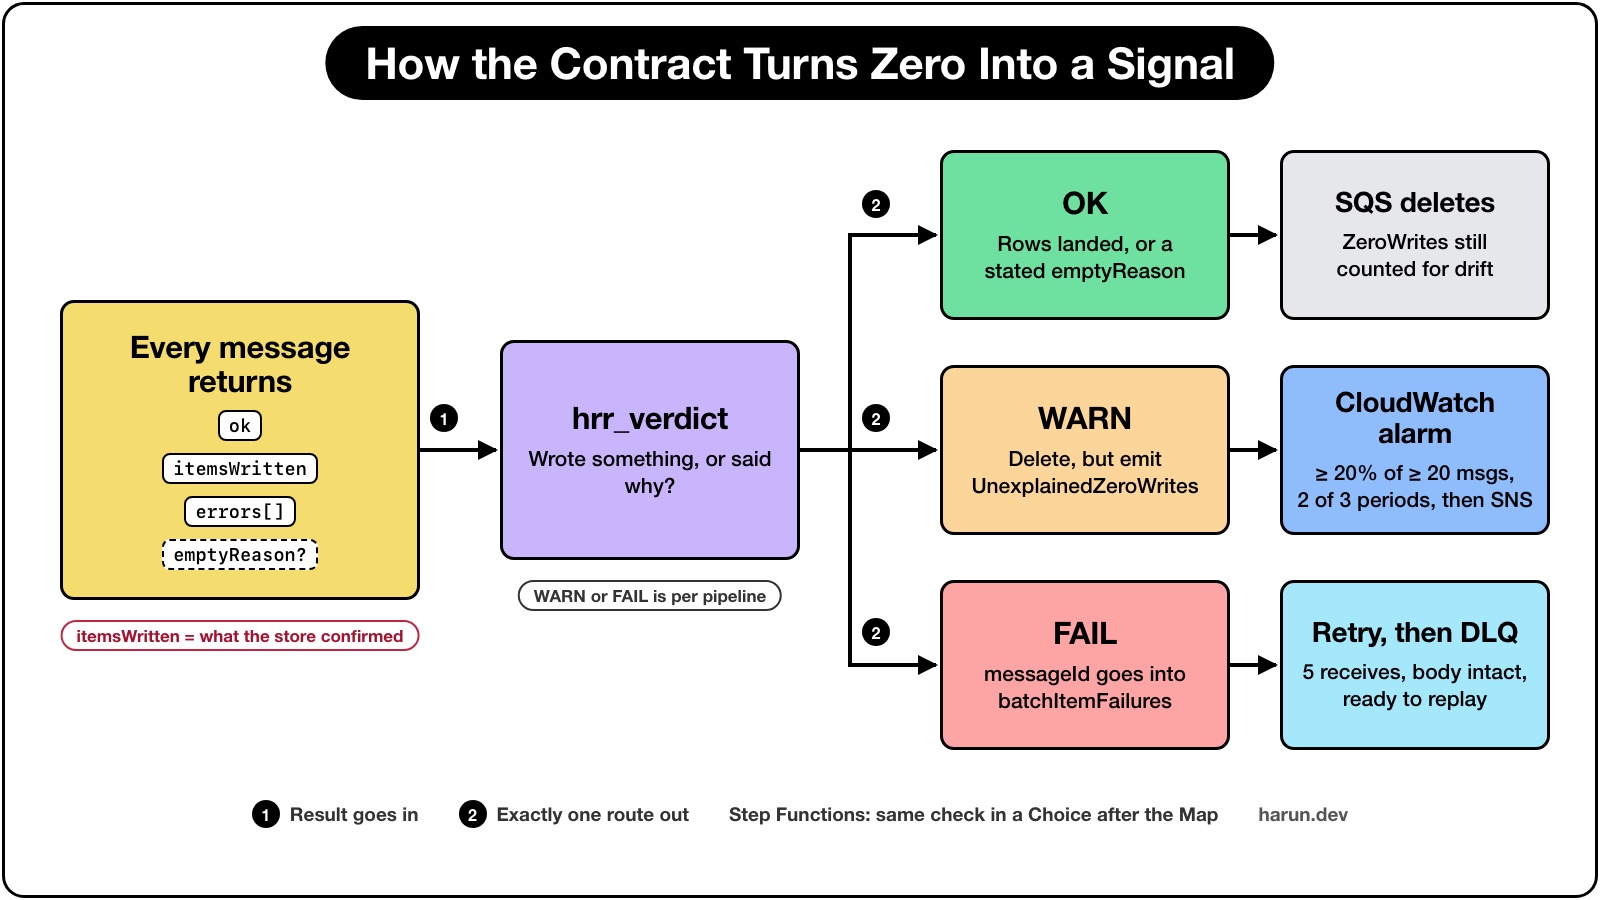
One result in, one route out. Only FAIL keeps the input; WARN leaves it to the alarm.
WARN or FAIL is a per-pipeline decision. These are the defaults I'd start with.
Pipeline
Zero writes on non-empty input means
Verdict
RAG embed and index
A document with text produced no vectors. Only "every chunk was a duplicate" excuses it.
FAIL
Memory extraction
Fine if the model called the tool and said nothing_to_extract. Anything else is unexplained.
FAIL
Ticket sync
An empty delta is common and a retry won't change it. A sudden spike is still worth seeing.
WARN
One thing the whole contract depends on: itemsWritten has to come from what the store confirmed. If it's memories.length, you've counted your intentions.
Send the same numbers to CloudWatch, without console.log
A returned object only helps a caller that reads it. The same counts go out as CloudWatch Embedded Metric Format, one JSON line per invocation.
export function hrr_emitMetrics(pipeline: string, counts: Record<string, number>) {
  // console.log adds a timestamp and request ID in text log format, which breaks EMF.
  process.stdout.write(
    JSON.stringify({
      _aws: {
        Timestamp: Date.now(),
        CloudWatchMetrics: [
          {
            Namespace: "Hrr/Pipelines",
            Dimensions: [["Pipeline"]],
            Metrics: Object.keys(counts).map((Name) => ({ Name, Unit: "Count" })),
          },
        ],
      },
      Pipeline: pipeline,
      ...counts,
    }) + "\n",
  );
}
The EMF spec wants a log event that is a JSON object with nothing before or after it. Lambda's default text format can't produce one: the Node runtime adds a timestamp, request ID and level to everything console.log writes, and in JSON log format CloudWatch can stop recognizing EMF that went through console.log at all. AWS's fix is process.stdout.write. That's what this uses.
Emit zeros, because a rate needs its denominator in every period. Keep messageId out of the dimensions too: every unique dimension value creates a new custom metric.
In partial batch responses, an empty list means delete everything
The handler's only way to tell Lambda about a bad message is batchItemFailures, and the rules are strict.
Handler does
Lambda treats the batch as
Returns an empty or null batchItemFailures, or an empty or null response
Complete success
Returns specific valid itemIdentifier values
Partial failure. Only those messages come back.
Throws
Complete failure
Returns invalid JSON, or an itemIdentifier that's empty, null, misnamed, or not in the batch
Complete failure
A no-op writer plus { batchItemFailures: [] } is the worst version of this bug. Lambda reports success and SQS deletes the input. There's nothing left to replay. FAIL has to become an entry in that list, so the message comes back and eventually lands in the DLQ with its body intact.
The catch is the standard pattern, and it also means per-message exceptions never reach Lambda's Errors metric. FailedMessages exists to count them.
SQS isn't a caller that reads your contract. The full result goes to the log, and the counts go to EMF. The response stays as just batchItemFailures. That's the only key AWS documents for it.
Don't forget function_response_types. Without it, the list your handler returns isn't a partial batch response, and the unit test below can't tell. maxReceiveCount of 5 and a visibility timeout of six times the function timeout are AWS's recommendations.
FAIL has a price. If the writer is broken for everyone, every message runs the whole extraction up to five times before reaching the DLQ, and AWS notes that Lambda doesn't scale down polling on failed invocations when ReportBatchItemFailures is on. I'd still pay it for pipelines where losing the input is worse than the repeat calls. Where it isn't, use WARN and let the alarm do the work.
A FIFO queue needs a different loop: stop at the first failure and return everything unprocessed, so ordering holds.
Three ways a model reply turns into nothing
The OpenViking report had three gaps, and the dev.to write-up explains why each one looked defensible on its own. That stack was a self-hosted model server. This is my adaptation to Bedrock, not something the report measured there.
The wrong parse channel. In the original, tool-call markup leaked into the content field and the parser only looked in the structured channel, and since Converse separates text and toolUse blocks the same markup may never show up. The same shape can, though: tool JSON sitting in a text block with no toolUse at all. Setting toolChoice to any or tool narrows this down where the model supports it. I'd keep the check anyway, since stopReason can also come back as malformed_model_output or malformed_tool_use.
The retry budget spent on garbage. One shared format-retry counter means a junk reply can use the only retry before a real formatting slip shows up. Each failure kind gets its own budget.
The flag that disabled the recovery path. A flag built for "the model called a tool that doesn't exist" was reused for any parse failure, so a model that answered "let me search first" ran its next iteration with tools off and guaranteed the empty result. The fix below is blunt: callModel has no parameter that turns tools off. Nobody can reuse it. A bad reply changes the prompt and nothing else.
const HRR_TOOL = "hrr_save_memories";
const HRR_BUDGET = { wrong_channel: 1, prose: 2, malformed: 1 };

type HrrReply =
  | { kind: "tool"; input: any }
  | { kind: keyof typeof HRR_BUDGET; text: string };

export function hrr_readReply(response: any): HrrReply {
  const blocks = response.output?.message?.content ?? [];
  const call = blocks.find((b: any) => b.toolUse?.name === HRR_TOOL)?.toolUse;
  if (call) return { kind: "tool", input: call.input };

  const text = blocks.map((b: any) => b.text ?? "").join("").trim();
  if (response.stopReason?.startsWith("malformed_")) return { kind: "malformed", text };
  const looksLikeACall = text.startsWith("{") || text.includes(HRR_TOOL);
  return { kind: looksLikeACall ? "wrong_channel" : "prose", text };
}

export async function hrr_extract(
  transcript: string,
  callModel: (prompt: string) => Promise<any>,
) {
  const left = { ...HRR_BUDGET };
  const errors: HrrError[] = [];
  let hint = "";

  while (true) {
    const reply = hrr_readReply(await callModel(transcript + hint));
    if (reply.kind === "tool") return { ...reply.input, errors };

    errors.push({ code: reply.kind, message: reply.text.slice(0, 200) });
    if (left[reply.kind]-- === 0) return { memories: null, errors };
    hint = `\n\nCall ${HRR_TOOL}. Put the result in the tool call, not in text.`;
  }
}
Every failed attempt goes into errors, and those reach ItemErrors. That closes the third gap from the original report, where the list existed and never left the container. As the write-up puts it, "A failure that is logged is not a failure that is visible." The maintainers later closed the issue as a serving and model-side problem, according to that post's update, and parse-failure counters went into a separate PR, still open as of November 2026.
A Map state can succeed over nothing
Step Functions has the same blind spot one level up. A Map state's output is an array of iteration outputs, and an empty array is a perfectly valid result. The check goes in a Choice right after each Map.
The definition below is the part that matters, in JSONata. A chunking Task before it returns documentId, documentBytes and chunks, and each iteration returns the contract.
"Non-empty input" is measured in documentBytes, because a chunker that returns [] for a real document looks like an empty input if you only count chunks. The $append wrappers are there for a related reason: JSONata returns undefined when a path matches nothing, Step Functions treats that as States.QueryEvaluationError, and a Choice state has no Catch, so the Map's Catch and the Choice both point at the same SNS Task. That Task ends in a Fail state, so the execution really is FAILED.
The state machine role needs sns:Publish on that topic. The per-chunk Lambda should call hrr_emitMetrics too, so ingest shows up on the same dashboard.
This matters more than a missed write in the RAG post's design. Its sweep runs after the Map and deletes every chunk for the document whose ingest_run_id isn't the current run. A writer that no-ops would leave no rows on the current run, so a "successful" Map followed by the sweep would delete the whole document's chunks. The check belongs before the sweep.
That post also uses a Distributed Map with ResultWriter, and this exact Output won't work there. With an S3 export, the state returns only MapRunArn and ResultWriterDetails. There's no array to sum. Add a small Task that reads manifest.json, parses each child's Output string from the SUCCEEDED_n.json files, and returns the same fields to the same Choice.
Put success rate and zero-write rate side by side
Either number alone misleads. Take a five-minute window where the failure is invisible:
Illustrative window
Value
Messages
100
FailedMessages (policy set to WARN)
0
UnexplainedZeroWrites
100
Success rate
100%
Unexplained zero-write rate
100%
locals {
  hrr_ns = "Hrr/Pipelines"
  hrr_p  = "memory-extract"
}

resource "aws_cloudwatch_dashboard" "hrr_pipelines" {
  dashboard_name = "hrr-pipelines"

  dashboard_body = jsonencode({
    widgets = [
      {
        type   = "metric"
        x      = 0
        y      = 0
        width  = 12
        height = 6
        properties = {
          title  = "Success rate"
          region = var.aws_region
          view   = "timeSeries"
          stat   = "Sum"
          period = 300
          yAxis  = { left = { min = 0, max = 100 } }
          metrics = [
            [{ expression = "100 * (messages - failed) / messages", label = "Success %", id = "success" }],
            [local.hrr_ns, "Messages", "Pipeline", local.hrr_p, { id = "messages", visible = false }],
            [local.hrr_ns, "FailedMessages", "Pipeline", local.hrr_p, { id = "failed", visible = false }],
          ]
        }
      },
      {
        type   = "metric"
        x      = 12
        y      = 0
        width  = 12
        height = 6
        properties = {
          title  = "Zero-write rate"
          region = var.aws_region
          view   = "timeSeries"
          stat   = "Sum"
          period = 300
          yAxis  = { left = { min = 0, max = 100 } }
          metrics = [
            [{ expression = "100 * unexplained / messages", label = "Unexplained %", id = "unexplained_pct" }],
            [{ expression = "100 * zero / messages", label = "All zero-write %", id = "zero_pct" }],
            [local.hrr_ns, "Messages", "Pipeline", local.hrr_p, { id = "messages", visible = false }],
            [local.hrr_ns, "UnexplainedZeroWrites", "Pipeline", local.hrr_p, { id = "unexplained", visible = false }],
            [local.hrr_ns, "ZeroWrites", "Pipeline", local.hrr_p, { id = "zero", visible = false }],
          ]
        }
      },
    ]
  })
}
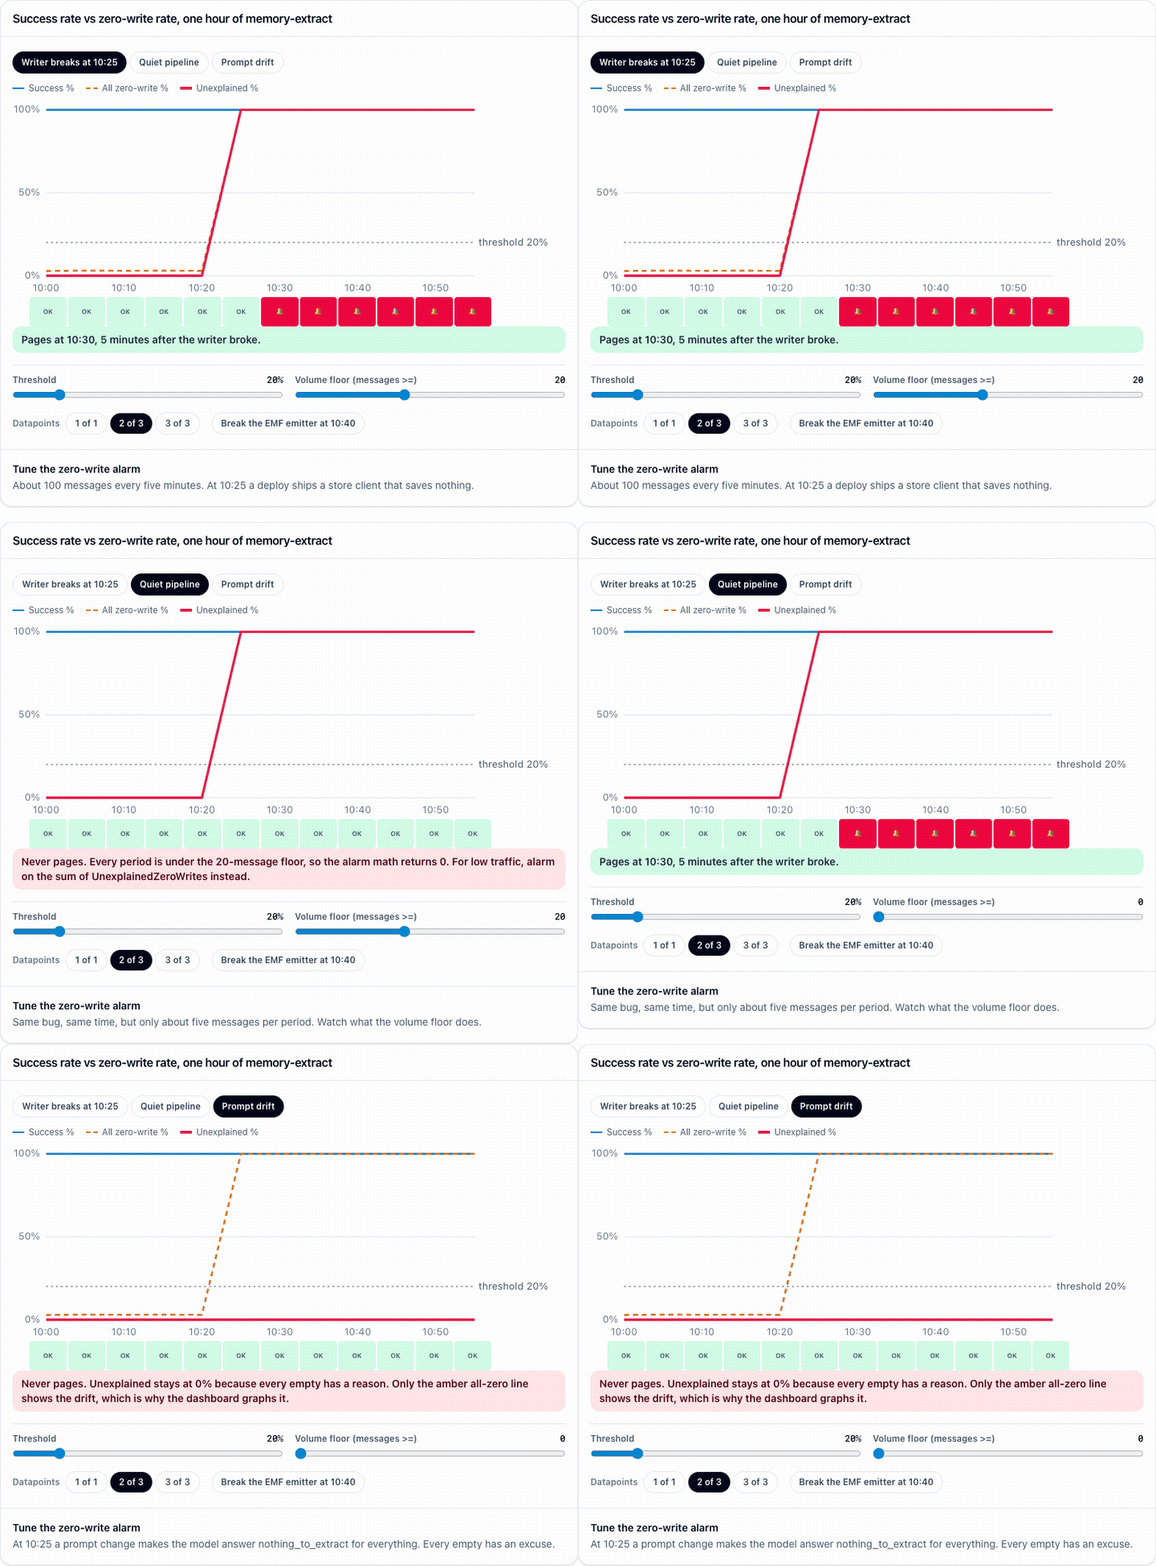
I'd graph all zero-writes next to the unexplained ones on purpose. If a prompt change makes the model answer nothing_to_extract for everything, every message has an excuse and the unexplained line stays flat. The total line climbs.
Alarm on the spike, and mind the floor
The alarm uses the same rate, with a minimum volume so one empty message at 3 a.m. doesn't page anybody.
resource "aws_sns_topic" "hrr_pipeline_alerts" {
  name = "hrr-pipeline-alerts"
}

resource "aws_cloudwatch_metric_alarm" "hrr_zero_write_spike" {
  alarm_name          = "hrr-memory-extract-zero-write-spike"
  alarm_description   = "Messages processed OK with nothing written and no stated reason."
  comparison_operator = "GreaterThanOrEqualToThreshold"
  evaluation_periods  = 3
  datapoints_to_alarm = 2
  threshold           = 20
  treat_missing_data  = "notBreaching"
  alarm_actions       = [aws_sns_topic.hrr_pipeline_alerts.arn]
  ok_actions          = [aws_sns_topic.hrr_pipeline_alerts.arn]

  metric_query {
    id          = "zero_write_pct"
    expression  = "IF(messages >= 20, 100 * unexplained / messages, 0)"
    label       = "Unexplained zero-write %"
    return_data = true
  }

  metric_query {
    id = "messages"
    metric {
      namespace   = "Hrr/Pipelines"
      metric_name = "Messages"
      dimensions  = { Pipeline = "memory-extract" }
      period      = 300
      stat        = "Sum"
    }
  }

  metric_query {
    id = "unexplained"
    metric {
      namespace   = "Hrr/Pipelines"
      metric_name = "UnexplainedZeroWrites"
      dimensions  = { Pipeline = "memory-extract" }
      period      = 300
      stat        = "Sum"
    }
  }
}
That alarm over an hour of illustrative traffic. Move the threshold and the floor, change how many datapoints it needs, and try the three scenarios, starting with the quiet pipeline and the prompt drift, because those are the ones that never page. Then break the EMF emitter and watch the alarm clear itself.
The 20 messages and 20% are example numbers. Tune them to your traffic. A pipeline that gets five messages an hour never clears that floor. Alarm directly on a sum of UnexplainedZeroWrites instead.
EMF metrics depend on log delivery, and AWS suggests M out of N alarms when you can't control log flushing, which is the case in Lambda, so 2 of 3 periods. notBreaching has a cost too: if the emitter itself breaks, missing data reads as OK, and that's a silent success about your silent success detector. Add alarms on EMFParsingErrors and EMFValidationErrors in the AWS/Logs namespace with the LogGroupName dimension. The test below covers the code path.
The regression test a no-op writer can't pass
Feed a non-empty SQS batch through the real handler and the real processor, stub only the model and the store, and make the store do nothing.
import test from "node:test";
import assert from "node:assert/strict";
import { hrr_makeProcessor, hrr_makeSqsHandler } from "./hrr_pipeline.ts";

const hrr_event = {
  Records: [
    { messageId: "id1", body: "user: I moved to Dhaka" },
    { messageId: "id2", body: "user: I switched to Terraform" },
  ],
} as any;

test("non-empty batch plus a no-op writer fails and moves the metric", async (t) => {
  const lines: string[] = [];
  t.mock.method(console, "warn", () => {});
  const stdout = t.mock.method(process.stdout, "write", (line: string) => {
    lines.push(line);
    return true;
  });

  const handler = hrr_makeSqsHandler({
    pipeline: "memory-extract",
    onUnexplainedEmpty: "FAIL",
    process: hrr_makeProcessor({
      callModel: async () => ({
        stopReason: "tool_use",
        output: {
          message: {
            content: [
              {
                toolUse: {
                  toolUseId: "t1",
                  name: "hrr_save_memories",
                  input: { memories: [{ fact: "lives in Dhaka" }] },
                },
              },
            ],
          },
        },
      }),
      // The bug under test: the store accepts the call and saves nothing.
      write: async () => ({ written: 0, duplicates: 0 }),
    }),
  });

  const response = await handler(hrr_event);
  stdout.mock.restore();

  assert.deepEqual(response.batchItemFailures, [
    { itemIdentifier: "id1" },
    { itemIdentifier: "id2" },
  ]);

  const emf = JSON.parse(lines.find((line) => line.includes('"_aws"'))!);
  assert.equal(emf.Messages, 2);
  assert.equal(emf.ItemsWritten, 0);
  assert.equal(emf.UnexplainedZeroWrites, 2);
  assert.equal(emf.FailedMessages, 2);
});
It needs no AWS account and no mocking library. All the TypeScript in this post lives in one file, hrr_pipeline.ts, with import type { SQSEvent, SQSBatchResponse, SQSBatchItemFailure } from "aws-lambda" at the top, and those types come from @types/aws-lambda. Run the test with node --test on a Node version that strips types, or through your own TypeScript runner.
The handler and this test run as written under node --test. The JSONata expressions were evaluated against sample inputs with jsonata 2.0.6, the version Step Functions implements, and the Terraform passes terraform validate on AWS provider 6.72, though none of it has been deployed as a full stack, so test the alarm and the state machine in your own account before you trust them.
Hope you enjoyed this one. If your pipeline has an empty-success case this contract wouldn't catch, I'd like to hear about it.



On this post
Comments
A reply stays under the note it answers.
No comments yet.
If you have a note on How to Catch AWS Lambda Jobs That Succeed but Write Nothing, sign in and leave it.