How I Add LLM Observability to a Real AWS App with Langfuse, Lambda, and CloudWatch
How I connect Langfuse, Lambda, and CloudWatch so I can trace prompt behavior, cost, retries, and failures in a production AWS app
AWSAIDevopsServerlessObservability
How I connect Langfuse, Lambda, and CloudWatch so I can trace prompt behavior, cost, retries, and failures in a production AWS app
Draft note: This article is currently drafted for review only and will stay out of the public blog index until I publish it.
I have learned the hard way that an LLM feature is not production-ready just because the prompt works in a notebook.
The real question is whether I can tell what happened when it fails at 2 a.m. Did the model answer badly? Did the prompt change? Did the Lambda retry? Did the request time out because the upstream API was slow? Or did I just spend ten minutes staring at a CloudWatch log stream that only says Error: failed request?
That is why I started treating observability as part of the feature, not as a nice-to-have later. In my AWS apps, I want two things at the same time: a product-level trace of the LLM interaction and an infrastructure-level trace of the Lambda execution. Langfuse gives me the first. CloudWatch gives me the second. Together, they tell me what actually happened instead of what I hope happened.
I am not talking about a toy demo. I mean a real Lambda-backed app that accepts a request, builds a prompt, calls a model, maybe retries once, and stores or returns the result. That could be a support assistant, a document summarizer, a code review helper, or an internal workflow tool.
Once money, latency, and user trust are involved, you need to answer a few simple questions for every request:
What prompt version ran? Which model and provider handled it? How many tokens did it use? How long did it take? Did it retry? Did it fail before the model call or after? And if the answer was bad, can I replay the trace with the same inputs?
I do not need fifty dashboards. I need a small set of signals I can trust.
For the LLM side, I track:
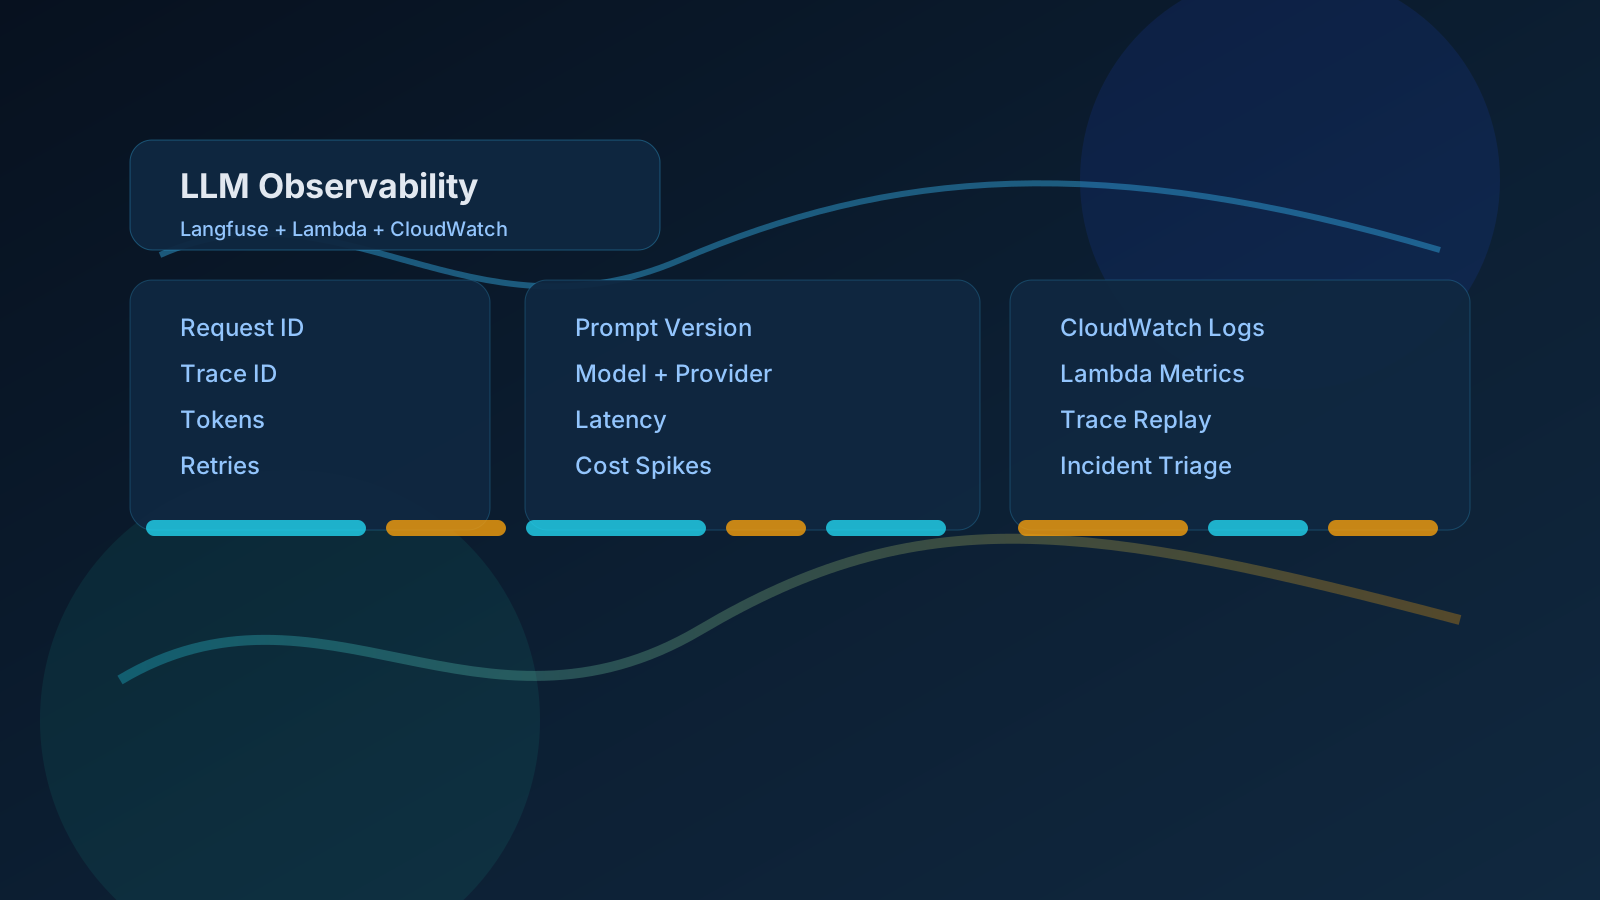
request ID, trace ID, prompt name, prompt version, model name, provider, input token count, output token count, latency, status, and retry count.
For the Lambda side, I track:
function name, invocation ID, cold start or warm start, duration, memory used, timeout risk, error type, and whether the request hit a retry path.
If I can correlate those two sets, I can usually answer the question that matters: was this an application problem, an LLM problem, or an infrastructure problem?
My rule is simple: the Lambda handler starts the trace, the model call creates the span, and the handler closes everything out whether the request succeeds or fails.
I keep the Langfuse object creation near the top of the handler so every downstream call can inherit the same trace context. The important part is not the SDK itself. It is the shape of the metadata. I want the trace to include enough context that I can search for a request without grepping logs like it is 2017.
{
  "request_id": "req_01J...",
  "trace_id": "langfuse_trace_abc123",
  "prompt_name": "support-reply",
  "prompt_version": "2026-06-03",
  "model": "anthropic/claude-sonnet-4",
  "provider": "anthropic",
  "tenant_id": "acme",
  "feature": "customer-support-assistant"
}
I also like to attach the user-facing outcome to the trace. Not the raw secret data, just the useful business result: success, fallback, refused, timed out, or human escalation.
Langfuse tells me what the model did. CloudWatch tells me what Lambda did around it.
That means CloudWatch logs should always include the Langfuse trace ID or the internal request ID that maps back to it. If I cannot jump from a bad CloudWatch log line into the exact Langfuse trace, the observability setup is already half broken.
In practice, I log a compact JSON line for each stage:
{
  "level": "info",
  "request_id": "req_01J...",
  "trace_id": "langfuse_trace_abc123",
  "stage": "llm_call_started",
  "prompt_version": "2026-06-03"
}
Then I use CloudWatch for the operational truth: did the function time out, did memory climb, did I hit throttling, did the retry loop fire, did a downstream API fail before the prompt was even sent?
If I need one place to start during an incident, I usually start in CloudWatch because it tells me whether the Lambda itself is healthy. Then I jump into Langfuse to see the prompt and model behavior. That sequence saves time.
I do not alert on every weird output. That is how you drown in noise.
The alerts I actually care about are boring and practical:
error rate, timeout rate, retry spikes, token cost spikes, latency spikes, and sudden changes in the distribution of model outputs or fallback usage.
If a prompt suddenly starts using twice as many tokens, I want to know. If the output length drops because the model is truncating or failing early, I want to know. If one tenant starts producing far more retries than everyone else, I want to know that too.
For the noisy stuff, like a single weird answer, I rely on traces and sample review instead of paging myself awake.
Observability is not the same as approval.
Even with Langfuse traces and CloudWatch logs, I still manually inspect a few things: prompt changes, model changes, fallback path changes, and anything that touches user-visible policy or safety. If the output is legally sensitive, customer-facing, or expensive, I do not let the dashboard make the decision for me.
I want observability to shorten the time to understanding. I do not want it to replace judgment.
The simplest version is the one I keep coming back to:
1. Give every request a request ID and trace ID.
2. Start a Langfuse trace at the Lambda boundary.
3. Record prompt version, model, provider, and token counts.
4. Log compact JSON to CloudWatch for each stage.
5. Alert on latency, retries, timeouts, and cost spikes.
6. Review the trace when something looks off.
7. Keep human review for anything risky or customer-facing.
That is not glamorous, but it is usable. And usable beats clever every time in production.
The biggest win is confidence. I can ship an LLM feature without feeling like I just launched a black box and hoped for the best.
When a bad result shows up, I can usually tell quickly whether I need to fix the prompt, tune the retry logic, raise the timeout, lower the token budget, or just accept that the model is being weird and handle it with a fallback.
That is the real value of LLM observability in AWS: not dashboards for their own sake, but a clear path from symptom to cause to fix.
If I were starting a new production LLM feature today, observability would not be the last thing I add. It would be one of the first.
I email when a new post goes up. One send a week, and only if there's something new.
Want this applied on your account? Start with Serverless Infrastructure.
Related reading
Kept below the post instead of in a sidebar, with a slow continuous motion for a cleaner editorial feel.
Aug 19, 2026
The 2026-07-28 MCP spec deleted the initialize handshake and Mcp-Session-Id, which should have been free for a Lambda server that was already stateless. It wasn't: a CORS allow-list, a missing server/discover, a 404 that should have been a 405, and a notification stream an HTTP API can't hold open all broke behind API Gateway.
Jul 25, 2026
A Bedrock-backed Fastify route on Lambda needs a contract after the model answers, not just before it. Zod on the output, RAG context treated as untrusted data, one repair pass then a 422, idempotent SQS, and the CloudWatch metrics that catch it drifting.
Jul 7, 2026
AI agents write code fast. They also write bugs, security holes, and nonsense. Here is the 12-item checklist I run before merging anything an agent touched.
Aug 19, 2026
The 2026-07-28 MCP spec deleted the initialize handshake and Mcp-Session-Id, which should have been free for a Lambda server that was already stateless. It wasn't: a CORS allow-list, a missing server/discover, a 404 that should have been a 405, and a notification stream an HTTP API can't hold open all broke behind API Gateway.
Jul 25, 2026
A Bedrock-backed Fastify route on Lambda needs a contract after the model answers, not just before it. Zod on the output, RAG context treated as untrusted data, one repair pass then a 422, idempotent SQS, and the CloudWatch metrics that catch it drifting.
Jul 7, 2026
AI agents write code fast. They also write bugs, security holes, and nonsense. Here is the 12-item checklist I run before merging anything an agent touched.
On this post
Comments
A reply stays under the note it answers.
No comments yet.
If you have a note on How I Add LLM Observability to a Real AWS App with Langfuse, Lambda, and CloudWatch, sign in and leave it.